


Logiline| Logistic CRM system - Site page "Dashboard"
The "Dashboard" page contains summary information on the main sections and allows quick access to the necessary sections for work.
To get started, select the funnel type - by default, the type "Deal" is set, but if necessary, you can choose another option from the dropdown list (Figure 1, Pointer 1). This will display data corresponding to the selected work direction.
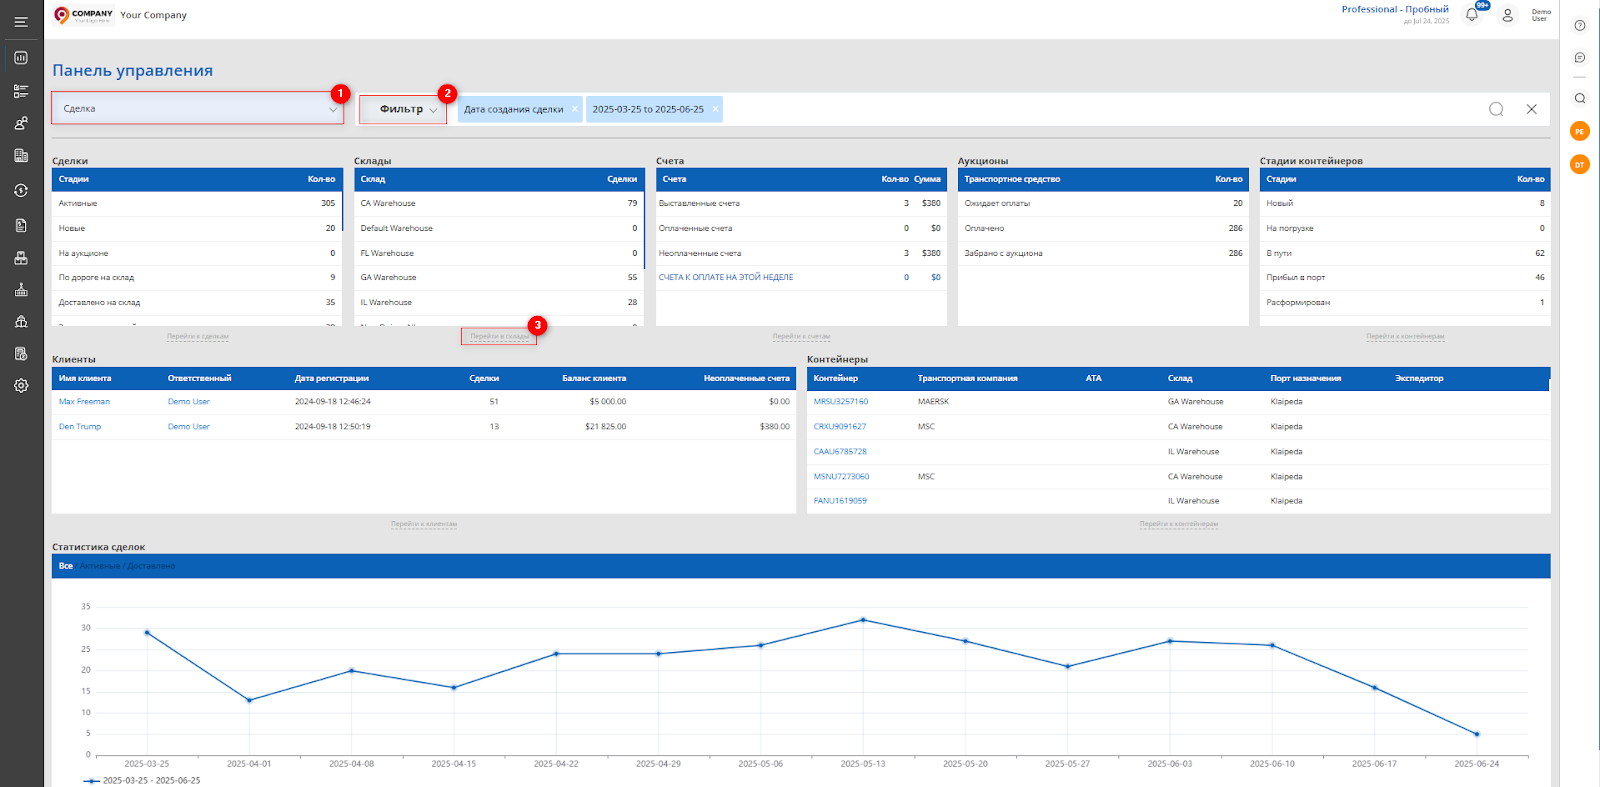 Figure 1 - Website page "Dashboard"
To configure the data display settings, click the "Filter" button (Figure 1, Pointer 2). This will open the filter window, where you can set the filter parameters (Figure 2):
-
"Date Type" - specify the type by which filtering will be performed: deal creation date, vehicle purchase date, or warehouse arrival date;
-
"Deal Creation Date" - set a specific date or time range for the search;
-
"Responsible" - select the employee assigned to the deal;
-
"Client" - choose a client from the dropdown list;
-
"Warehouse" - specify the warehouse where the vehicle is or will be located;
-
"Port of Destination" - indicate the port to which the vehicle is being shipped;
-
"Shipping Company" - select the company responsible for delivery;
-
"Date of Arrival at Port of Destination" - choose a specific date or period for the search.
The filter also includes a comparison function (Figure 2, Pointer 1). When activated, an additional field "Compare with Interval by Creation Date" will appear, where you need to specify the period for data comparison.
After entering the parameters, click the "Search" button, to cancel, click "Reset".
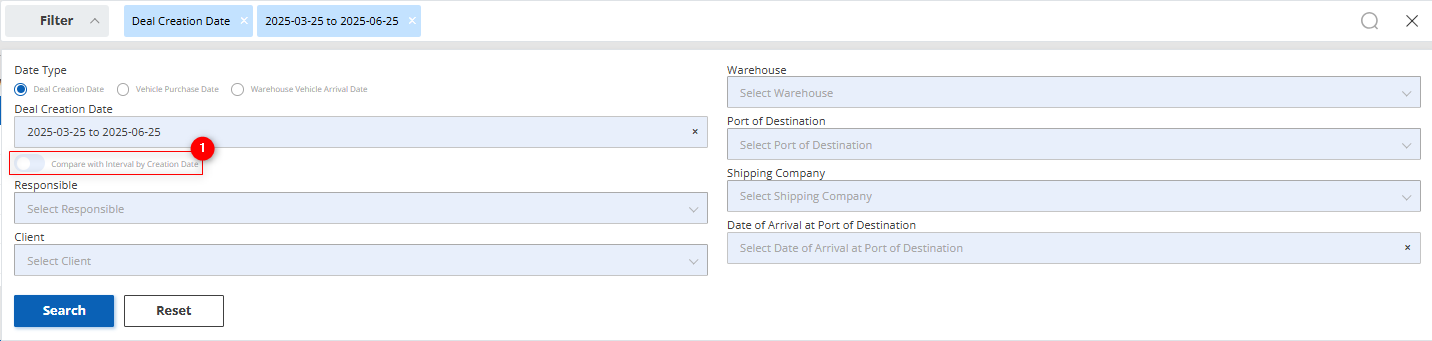 Figure 2 - Filter window
Next, the page contains several informative sections:
-
Deals — Displays the deal stages and the number of vehicles at each stage.
-
Warehouses — This section shows the number of deals for each warehouse.
-
Invoices — Displays information about invoices, indicating their number and total amount by status. This allows for a quick assessment of the financial state and payment control.
-
Auctions — Shows the number of lots by payment status at the auction, helping to track the vehicle purchase process.
-
Container Stages — Shows the total number of containers at different delivery stages.
-
Clients — A table with client data, including name, responsible employee, registration date, number of deals, client balance, and the amount of unpaid invoices. This information helps monitor client interactions and financial settlements.
-
Containers — A list of containers indicating the transport company, warehouse, destination port, freight forwarder, and ATA (actual time of container arrival at the destination port). This data is important for tracking delivery statuses, controlling delivery times, and coordinating with logistics partners.
Note: Each section provides the ability to go to the page represented in that section for more detailed information. To do this, click the "Go to" button (Figure 1, Pointer 3).
-
Deals Statistics — Displays a chart with deal dynamics for the selected period with the ability to filter by statuses (All, Active, Delivered). When the comparison function is activated in the filter, the chart shows two indicators: the main period (in blue) and the comparison period (in orange), making it easy to visually compare performance over different time periods (Figure 3).
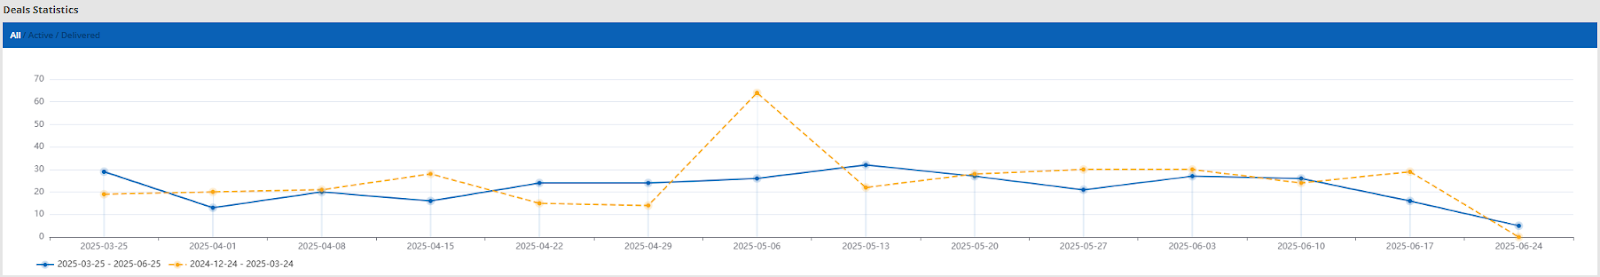 Figure 3 - Deal statistics chart